The pursuit of practical quantum computing relies on scalable architectures, and transistor-based quantum dots offer a promising path forward. By trapping single electrons in these semiconductor devices, we hope to process information using their internal degree of freedom – spin. However, achieving this requires precise control and tuning
Tuning Quantum Dots: A Complex Prelude to Quantum Operations
Before engaging in quantum operations, quantum dots must be carefully tuned to achieve the desired number of electrons. This involves adjusting voltages on metallic gates, a process fraught with challenges like parameter drift and the difficulty of sensing charge configurations. Tuning even a small number of quantum dots manually is labor-intensive, making the task infeasible as the number of dots grows. This underlines the necessity for autonomous tuning methods to advance the field. (See: Autonomous Bootstrapping of Quantum Dot Devices or Fully autonomous tuning of a spin qubit)
Charge Stability Diagrams: The Map to Electron Configuration
A critical tool in quantum dot tuning is the charge stability diagram (CSD), a two-dimensional voltage map depicting charge configurations.
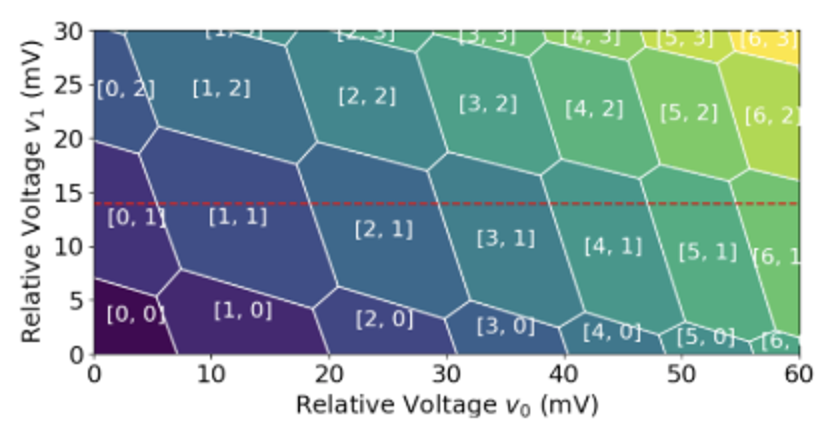
These diagrams are governed by the capacitance model, where electrostatic energy determines charge states. Clean and well-defined CSDs enable the extraction of model parameters, such as the size and slopes of Coulomb diamonds, which are essential for understanding and optimizing the system.
Overcoming Challenges with Scalable Strategies
As the number of quantum dots increases, the number of CSD cuts grows exponentially, making manual analysis impractical. Current strategies include:
- Autonomous identification of features like diamond edges and slopes.
- Using convolutional neural networks (CNNs) in a supervised fashion to extract parameters.
We propose a simpler yet effective alternative: leveraging Fourier transforms to analyze CSDs.
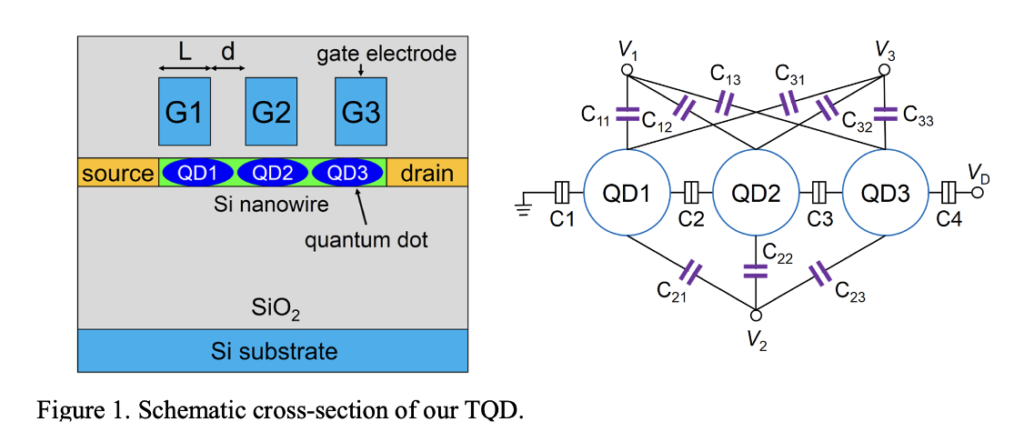
Capacitance Model: The Physics Behind CSDs
The system can be described using a capacitance matrix that links charges and voltages on the dots and gates, analogous to the relationship \( Q = CV \):
$$
\begin{pmatrix}
Q_D \\
Q_G
\end{pmatrix} =
\begin{pmatrix}
C_{DD} & C_{DG} \\
C_{DG}^T & C_{GG}
\end{pmatrix}
\begin{pmatrix}
U_D \\
V_G
\end{pmatrix}
$$
Here:
- \(C_{DD}\) : Dot-dot capacitance matrix.
- \( C_{DG} \) : Dot-gate cross-capacitance matrix.
- \(C_{GG}\) : Gate-gate capacitance matrix.
Minimising the electrostatic energy, \( E \), determines the charge configuration. This is visualised in a CSD, with gate voltages as axes and charge states represented by color. Parameters such as the size and slope of Coulomb diamonds are directly derived from this model.
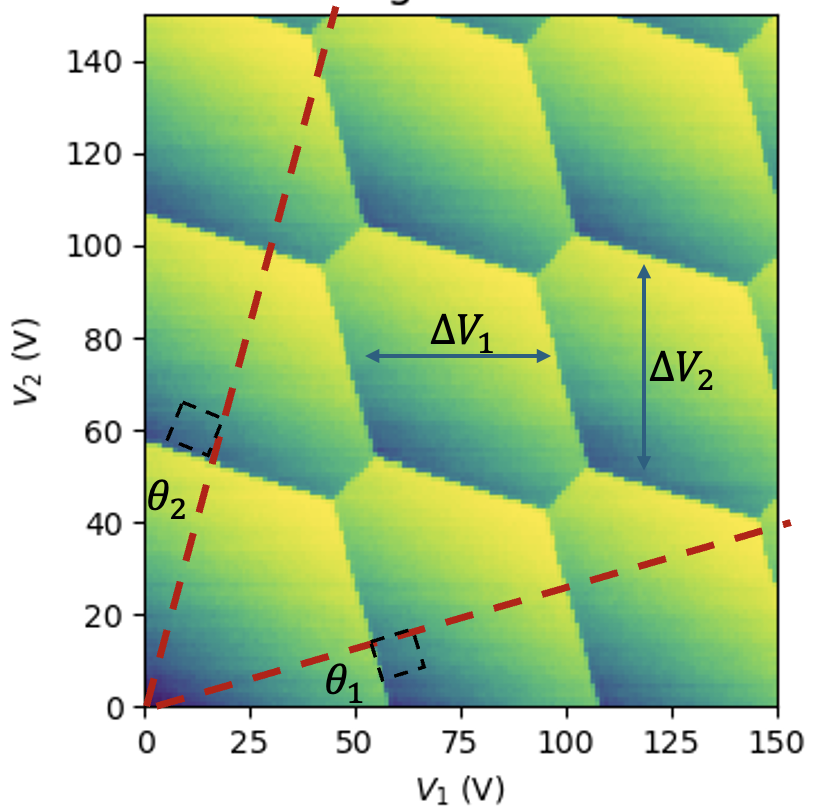
Key Parameters for Simplified Analysis
Four critical parameters derived from the capacitance model:
- Diamond Sizes: \( \Delta V_1, \Delta V_2 \)
\[
\Delta V_i = \frac{|e| C_{DD}^{-1}[i,i]}{(C_{DD}^{-1}C_{DG})[i,i]}
\] - Diamond Slopes: \( \theta_1, \theta_2 \)
\[
\theta_1 = \text{arctan}\left(\frac{\alpha[1,1]}{\alpha[1,2]}\right),\quad \theta_2 = \text{arctan}\left(\frac{\alpha[2,2]}{\alpha[2,1]}\right) \quad \alpha = C_{DD}^{-1}C_{DG}
\]
Our Procedure: Fourier Transform Analysis of CSDs
Our method focuses on two-dot systems but can be generalized to larger setups. Here’s the step-by-step process:
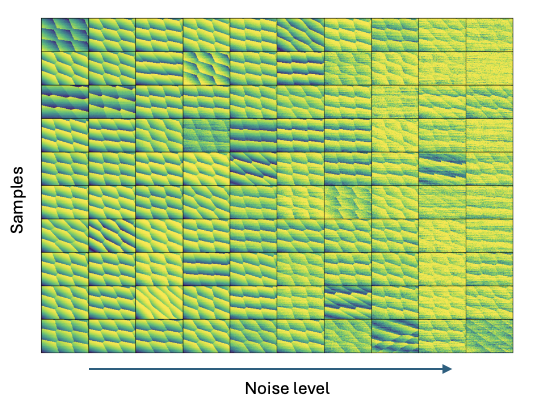
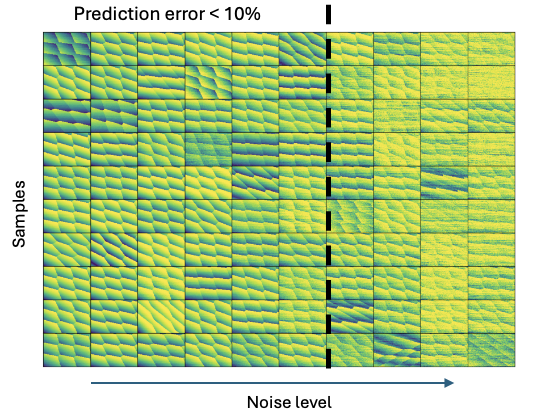
1. Data Acquisition
Charge stability diagrams are obtained experimentally by sweeping gate voltages and measuring responses, such as currents through sensing dots. Alternatively, synthetic data can be generated using the QDarts simulator to explore different noise levels. Below we present 10 CSDs obtained for a different level of noise (x-axis)
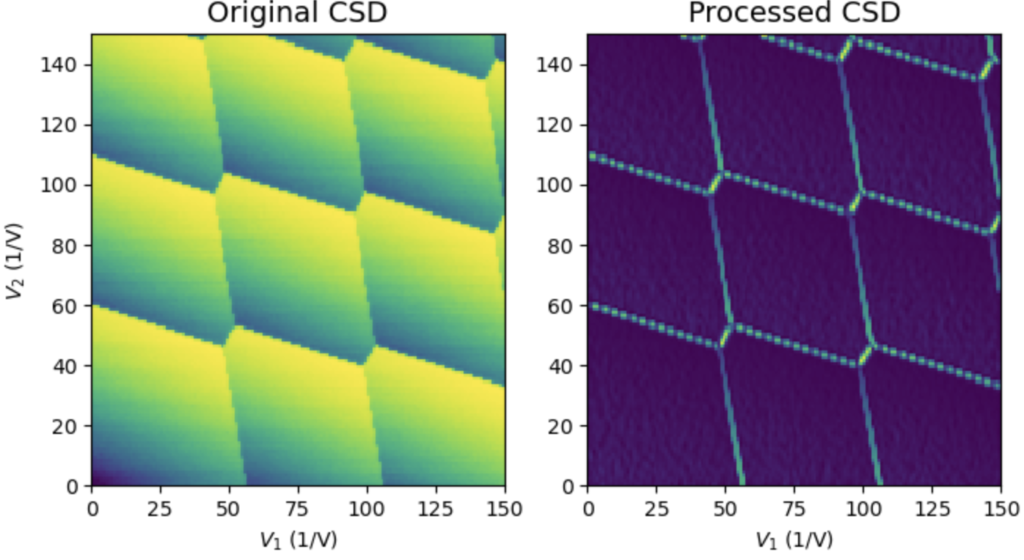
2. Edge Extraction
We use the Sobel filter, a simple edge-detection tool with 3×3 kernels, to identify horizontal and vertical edges. The resulting gradient magnitudes highlight the edges of Coulomb diamonds.
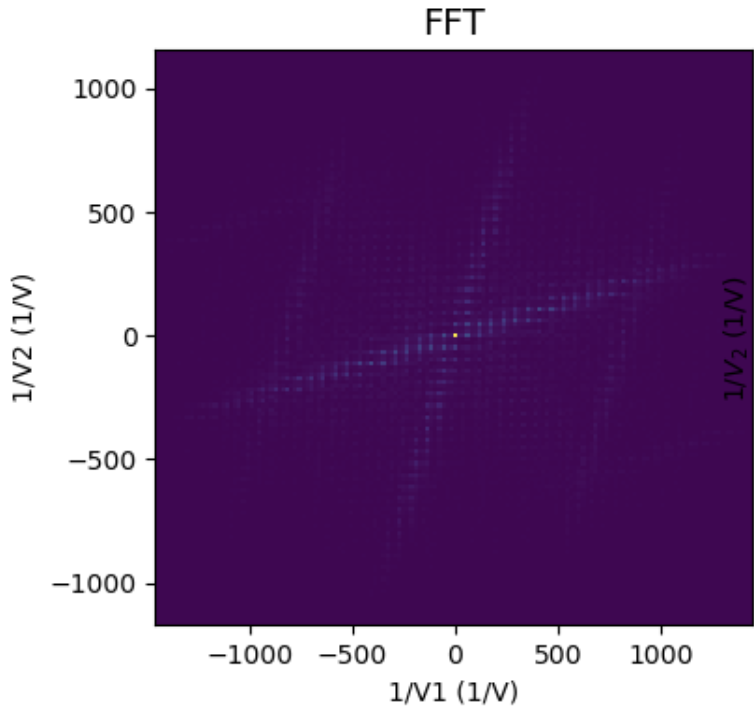
3. Fourier Transform
Applying a two-dimensional Fourier transform (fft2) to the filtered image reveals periodic structures in the CSD. The transform captures prominent “jets” corresponding to the directions perpendicular to the diamond edges.
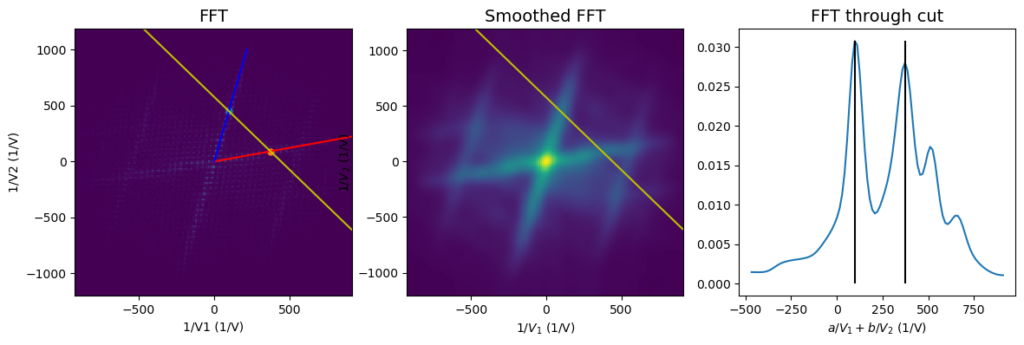
4. Jet Identification
To identify jets, we:
- Smooth the Fourier transform image using a Gaussian filter.
- Locate peaks along a specific cut of the Fourier-transformed space. These peaks define the jets, allowing us to extract angles \( \theta_1 \) and \( \theta_2 \).
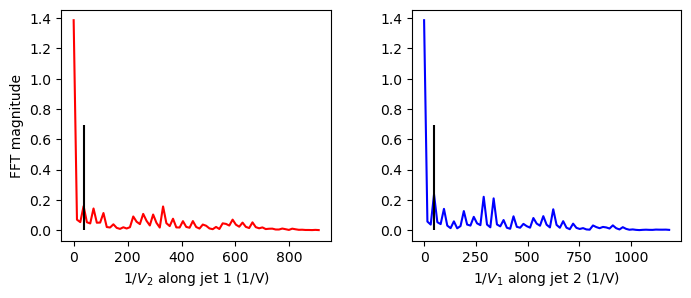
5. Period Extraction
The period of oscillations along the jets is determined by the distance from the origin to the first peak along each jet. This period is inversely proportional to the size of the Coulomb diamonds.
Results: Analyzing Synthetic Data
Using synthetic data generated by the QDarts simulator, we validated our method’s accuracy under varying noise levels. The Fourier-based approach proved robust, efficiently extracting key parameters even in noisy conditions.
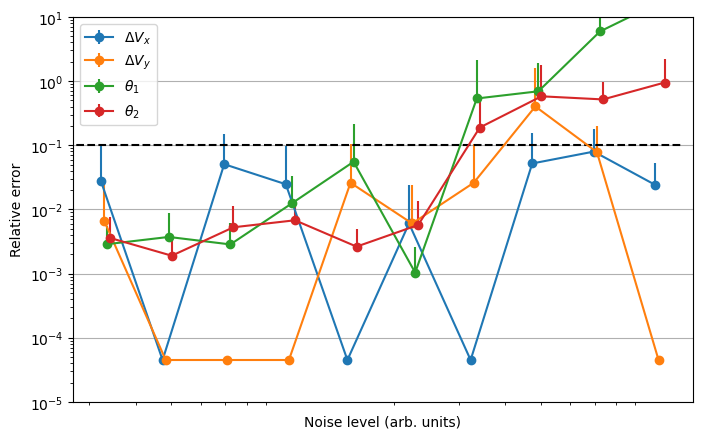
Clearly below certain noise level, the relative prediction error in any of the quantites is less than 10%. In general it is likely to be dominated by the “unlucky” CSD.
Conclusion
The Fourier transform-based method offers a simplified, yet effective way to extract parameters underlying charge stability diagrams in the autonomous way.
Code availability
The code is available at: https://github.com/jan-a-krzywda/ftt-charge-stability-diagram
Data: data_csd_fft.zip
Outlook and limitations
TODO